
EDA of Pima Indians Diabetes (with R)
Background
Diabetes is a disease caused by a malfunctioning hormone insulin. The pancreas releases insulin to help our body store and use carbohydrate and fat from the food we consume. Diabetes may occur when the pancreas produces very little or no insulin, or when our body does not respond appropriately to insulin. Even though this is beyond the scope of this analysis, there are three main types of diabetes: type 1, type 2 and gestational.
Data
This is an exploratory analysis of Pima Indians Diabetes data set. The data is from the Uci archive using R.
The data set consist of 768 records with 9 variables of females with at least 21 years old of Pima Indians heritage. The variables are:
- Number of times pregnant
- Plasma glucose concentration a 2 hours in an oral glucose tolerance test
- Diastolic blood pressure (mm Hg)
- Triceps skin fold thickness (mm)
- 2-Hour serum insulin (mu U/ml)
- Body mass index (weight in kg/(height in m)^2)
- Diabetes pedigree function
- Age (years)
- Class variable (0 or 1) (class value 1 is interpreted as “tested positive for diabetes”)
The class variable is the dependent or response variable with 0 (tested negative for diabetes) and 1 (tested positive). I want to respond to few questions here:- Can the Diabetes pedigree function tell us something?
- Can the Bmi, number of times pregnant influence the diabetes test?
- Is there a relationship between Bmi and Triceps skin fold thickness?
The original data has 500 tested negatives and 268 positives after removing the missing values, we have 262 tested negatives and 130 positives.
Can the Diabetes pedigree function influence the diabetes test?
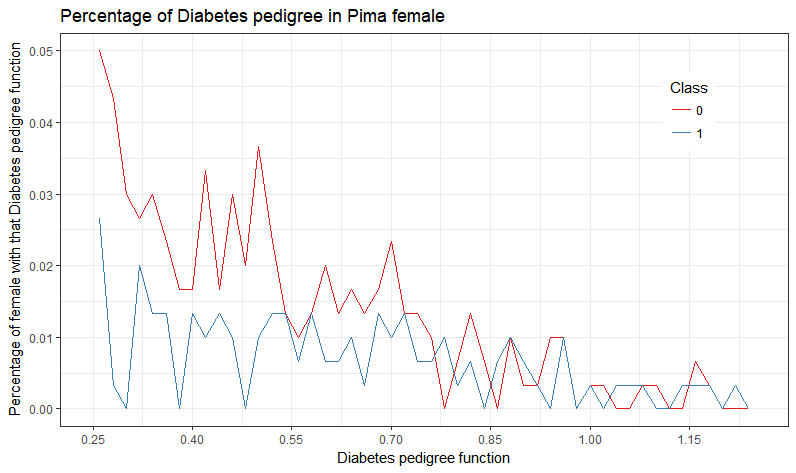
Most female tested negative for diabetes, have a diabetes pedigree function less than 0.80.
The diabetes pedigree function gives a synthesis of the diabetes mellitus history in an
individual’s family. So, it is most likely that a person with a high value will be tested
positive for diabetes.We can see that most Portuguese wine had an alcohol percent around 9.5.
Can Bmi, number of times pregnant influence the diabetes test?
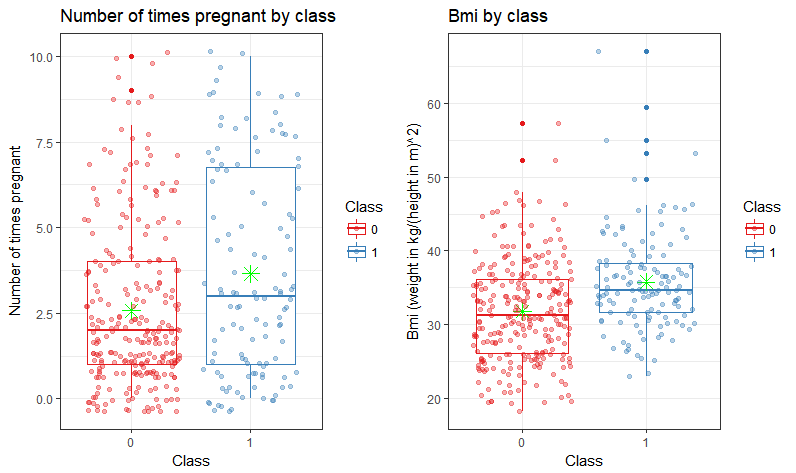
This plot shows that female who tested positive (or 1) have a higher bmi and number times pregnant than those who
tested negative. In fact, high Bmi usually means high risk of diabetes.
Is there a relationship between Bmi and Triceps skin fold thickness?
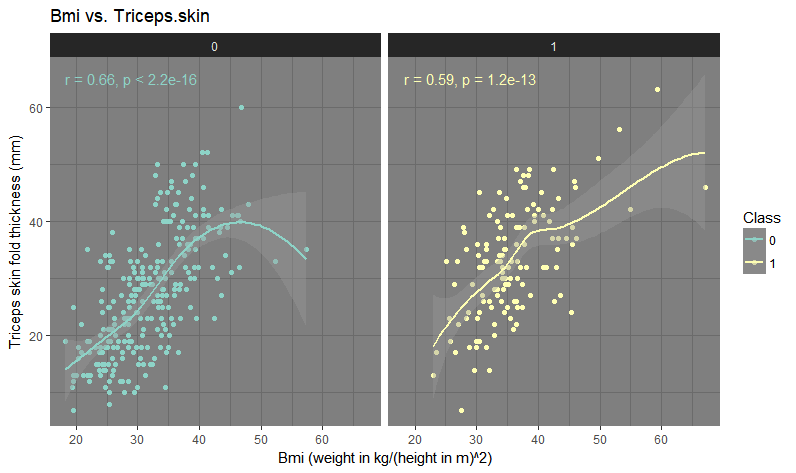
This plot shows that there is a strong relationship between Bmi and triceps skin.
It is clear that as Bmi increases, triceps skin also increases. The correlation is higher for female tested negative
than those who tested positive, but there are some points than could be considered as outliers.
To conclude
From this analysis, we can see that all these parameters like Bmi, diabetes pedigree function, number of time pregnant and triceps skin can help to predict if a woman will be tested positive for diabetes or not. There were many missing values and outliers, so for a prediction this should be taking into account.