Multiple models Nesarc data (with Python)

Can we predict the antisocial disorder among young girls aged between 18-28 years old?
Background
On the last post I used decision tree for prediction. On this one I will used random forest and logistic regression. The predictors are:
- S1Q6A HIGHEST GRADE OR YEAR OF SCHOOL COMPLETED
- S1Q11A TOTAL FAMILY INCOME IN LAST 12 MONTHS
- MAJORDEPLIFE MAJOR DEPRESSION IN LAST 12 MONTHS
- SOCPDLIFE SOCIAL PHOBIA - LIFETIME (NON-HIERARCHICAL)
- GENAXLIFE GENERALIZED ANXIETY DISORDER - LIFETIME
- HISTDX2 HISTRIONIC PERSONALITY DISORDER (LIFETIME DIAGNOSIS)
- S11BQ1 (BLOOD/NATURAL FATHER EVER HAD BEHAVIOR PROBLEMS)
- REGION
Here I use sklearn pipeline.
from sklearn.pipeline import Pipeline
from sklearn.preprocessing import StandardScaler, OneHotEncoder
from sklearn.compose import ColumnTransformer
cat_col = ['MAJORDEPLIFE', 'HISTDX2', 'S11BQ1', 'SOCPDLIFE', 'GENAXLIFE', 'REGION']
num_col = ['S1Q11A', 'S1Q6A']
numeric_transformer = Pipeline(steps=[
('scaler', StandardScaler())])
categorical_transformer = Pipeline(steps=[
('onehot', OneHotEncoder(handle_unknown='ignore'))])
preproces = ColumnTransformer(
transformers=[
('num', numeric_transformer, num_col),
('cat', categorical_transformer, cat_col)])
classifiers = [
RandomForestClassifier(),
LogisticRegression()]
# Create the pipeline for each model and evaluate
acc = []
model_names = []
for i, clf in enumerate(classifiers):
# Define pipeline with the model
full_pipeline = Pipeline(steps=[('preprocessing', preproces),
('model', clf)])
# Fit training data and define number of folds in Cross-Validation
full_pipeline.fit(X_train, y_train)
acc.append(cross_val_score(full_pipeline, X_train, y_train, scoring = 'accuracy', cv = 5))
# Display accuracy
model_names.append(clf.__class__.__name__)
print('{} Training Score: {}'.format(model_names[i], round(full_pipeline.score(X_train, y_train),4)))
print('{} Testing Score: {}'.format(model_names[i], round(full_pipeline.score(X_test, y_test),4)))
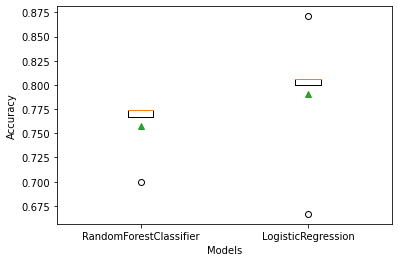
# Boxplot to visualize the scores
plt.boxplot(acc, labels=model_names, showmeans=True)
plt.xlabel('Models')
plt.ylabel('Accuracy')
Using cross validation, we can see that logistic regression has a higher accuracy than random forest.
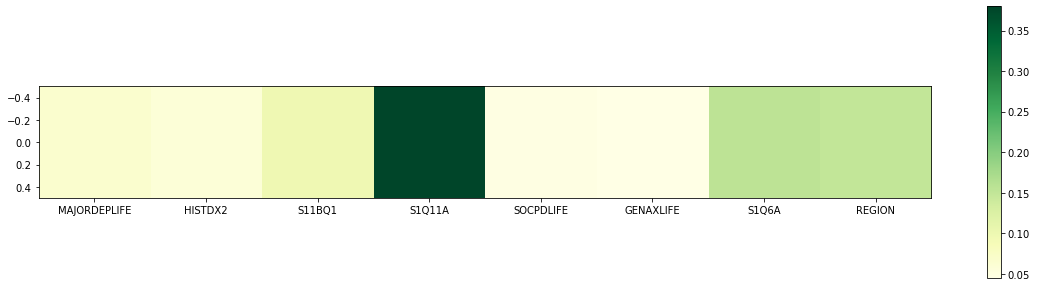
Most important features?
The most important feature to predict the antisocial disorder among young girls are:
- S1Q11A TOTAL FAMILY INCOME IN LAST 12 MONTHS
- S1Q6A HIGHEST GRADE OR YEAR OF SCHOOL COMPLETED
- REGION
To conclude
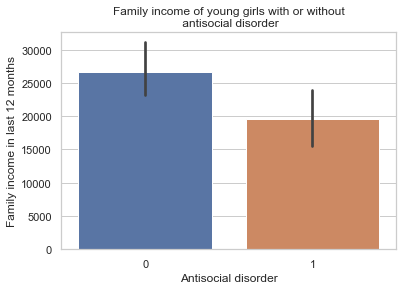
Family of Young girls with a antisocial disorder (coded 1 = “YES” and 0 = “NO”) has lower income than those without. The income is a good predictor of this disorder.